












Artyfact
ARTY Some indicatorsUSD chart
Artyfact
Over the past 30 days ARTY has lost 55.8%. ARTY ranks #310 of 577 in JRPG's gaming-token index by market cap.
JRPG's Token Health model scores it 50/100, strongest on community, weakest on liquidity. The Wash Trading Detector shows some indicators, a 28.4/100 trailing average over the 28 days scored. Four of its checks read reported market data. The fifth reads on-chain trades. The highest-scoring check is Peer Comparison, where volume outpaces comparable tokens. The top 10 wallets hold 41.4% of supply. Holder count held flat over the past week.
Converter
1 ARTY = $0.005041
Market Info
- Gaming Index Rank
- #310
- Market Cap
- $125k
- Fully Diluted Valuation
- $108k
- 24h Trading Volume
- $88k
- Market Cap 24h
- +38.42%
Supply Breakdown
Historical Price
- 24h Price Range
- $0.002784 – $0.005318
- 1-Year Range
- $0.002011 – $0.3271
- All-Time High
- $3.2 -99.86%Dec 26, 2023
- All-Time Low
- $0.002011 +116.79%Oct 21, 2026
Market Cap Analysis
- First Tracked
- Dec 21, 2023
- ATH Market Cap
- $32.1M
- 1Y Mcap Range
- $50k – $7.5M
- YTD Performance
- -97.15%
Price Performance
- 7 Days
- -27.33%
- 14 Days
- -56.28%
- 30 Days
- -55.76%
- 60 Days
- -79.89%
- 200 Days
- -93.49%
- 1 Year
- -98.66%
Holder History
Summed across every chain we can resolve this token on. Addresses, not people: one holder is counted on each chain they hold on.
31 readings shown, from 1 Sep 2026
Earlier counts are not on the same basis as these; from 01 Sep 2026 this is bsc, read chain by chain.
- Top 10: 41.3756%
- #11–30: 15.1905%
- #31–50: 7.1787%
- Rest: 36.2552%
-
Community Holder count, ownership concentration, and holder growth rate 70.6
-
Liquidity Pool reserves, volume-to-liquidity ratio, and valuation 20.7
-
Project Token age, social presence, and safety signals 55.0
-
Interest Volume trends, price momentum, and market cap 57.2
0 of 28 days scored had the trailing average above 45 with two or more sub-scores accusing.
-
Volume / Market Cap Ratio High reported volume relative to market cap can indicate artificial volume inflation 51
-
Price-Volume Divergence High volume with minimal price movement suggests the same entity is trading with itself 5
-
Volume Spike A sudden jump against the token's 30-day average volume, without a matching price move 0
-
Peer Comparison The token's volume-to-market-cap ratio against the median of tokens in the same categories 100
-
Round Trips Share of captured on-chain trades whose buy the same wallet reversed within 30 minutes at a matching size. One-sided: it can raise the score and never lower it, because the trade capture is a daily sample rather than a complete record 13
Frequently asked about Artyfact
Is Artyfact in JRPG's gaming-token index?
How healthy is Artyfact?
Does Artyfact show signs of wash trading?
How concentrated is Artyfact's ownership?
How has Artyfact performed recently?
What is Artyfact's market cap?
Games Using ARTYFACT

Artyfact News
-
 Game Update
Artyfact Quest Portal Makes Star Quests Mandatory
Artyfact Quest Portal now makes star quests mandatory before players can withdraw their rewards, and Artyfact crypto's ARTY token is in a slump.
September 15, 2026
-
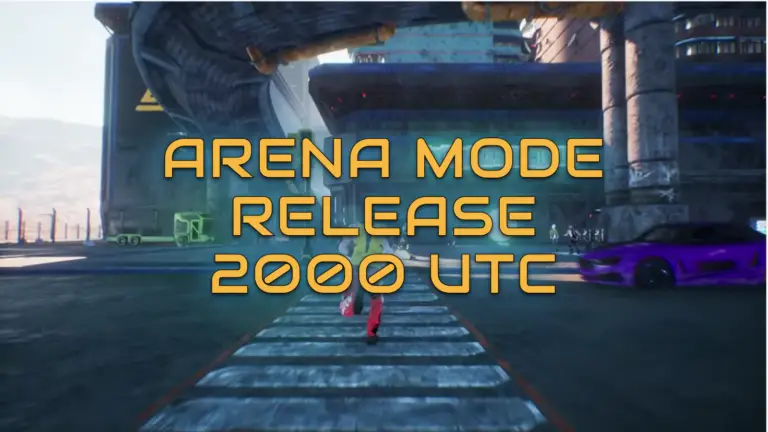 Game Update
Artyfact Announces Arena Mode Release
Artyfact launches Arena mode tomorrow with daily duels and rewards-see you in the arena!
June 30, 2026
-
 Event
Artyfact Unveils Leaderboard Rush Season 4
Artyfact's Leaderboard Rush Season 4 starts August 1 with bigger prizes and fresh challenges.
June 23, 2026