Axie Infinity
AXS Minimal indicatorsUSD$0.9302
+1.06%
24h
Price History
USD chart
About
Axie Infinity
AXS ranks #3 of 599 in JRPG's gaming-token index by market cap. Over the past 30 days AXS has lost 13.3%.
JRPG's Token Health model scores it 68/100, strongest on liquidity, weakest on project fundamentals. The Wash Trading Detector shows minimal indicators (18/100 signal score): volume outpaces comparable tokens. The top 10 wallets control 100.7% of supply. Holder count held flat over the past week.
Converter
Market Info
- Gaming Index Rank
- #3
- Market Cap
- $162.1M
- Fully Diluted Valuation
- $251.2M
- 24h Trading Volume
- $10.3M
- Market Cap 24h
- +0.87%
Tokenomics
Supply Breakdown
174.2M Circulating 270M Total 270M Max
Circulating 64.5%
Non-circulating 35.5%
Historical Price
- 24h Price Range
- $0.9222 – $0.9388
- 1-Year Range
- $0.8038 – $2.9
- All-Time High
- $164.9 -99.44%Nov 6, 2021
- All-Time Low
- $0.1237 +652.35%Nov 6, 2020
Market Cap Analysis
- First Tracked
- Mar 20, 2024
- ATH Market Cap
- $10.5B
- 1Y Mcap Range
- $134.8M – $488M
- YTD Performance
- +15.75%
Price Performance
- 7 Days
- -6.29%
- 14 Days
- -5.94%
- 30 Days
- -13.26%
- 60 Days
- -20.26%
- 200 Days
- +2.55%
- 1 Year
- -67.16%
Holder History
402,437
holders
7d: +0 (+0.00%) 30d: +0 (+0.00%)
Distribution
- Top 10: 100.6904%
- #11–30: 2.6633%
- #31–50: 0.3879%
68.1 / 100
overall score
Weighted average: Community 30%, Liquidity 30%, Project 25%, Interest 15%
-
Community Holder count, ownership concentration, and holder growth rate 61.8
-
Liquidity Pool reserves, volume-to-liquidity ratio, and valuation 88.0
-
Project Token age, social presence, and safety signals 55.0
-
Interest Volume trends, price momentum, and market cap 62.8
18.75 / 100
risk score
· medium confidence
-
Volume / Market Cap Ratio High trading volume relative to market cap can indicate artificial volume inflation 5
-
Price-Volume Divergence High volume with minimal price movement suggests wash trading 0
-
Volume Spike Sudden volume spikes without price movement may be artificially generated 0
-
Peer Comparison Volume patterns compared against tokens in similar categories 85
30-day trend
Frequently asked about Axie Infinity
Is Axie Infinity in JRPG's gaming-token index?
Yes. Axie Infinity is one of 599 constituents in JRPG's gaming-token index, ranked #3 by market cap. The index covers every eligible Web3 gaming token and reranks daily, so a token's position shifts as the market moves.
How healthy is Axie Infinity?
JRPG's Token Health model scores Axie Infinity 68 out of 100. Axie Infinity scores strongest on liquidity and weakest on project fundamentals, the high and low among the model's four on-chain signals. The rating updates daily from live on-chain data.
Does Axie Infinity show signs of wash trading?
JRPG's Wash Trading Detector shows minimal indicators for Axie Infinity, a 18/100 signal score. The clearest sign: volume outpaces comparable tokens. The detector reads reported trading for signs of manufactured volume, so a lower score points to organic activity and a higher one warrants caution.
How concentrated is Axie Infinity's ownership?
The top 10 wallets hold 100.7% of Axie Infinity's circulating supply, a concentrated holder base. Holder count held flat over the past week. When a handful of wallets hold most of the supply, they can move the price by trading, while a wider spread of holders softens that swing.
How has Axie Infinity performed recently?
Over the past 30 days Axie Infinity has lost 13.3%. A 30-day window captures the token's recent trend while filtering out single-day noise.
What is Axie Infinity's market cap?
Axie Infinity's market cap is about $162.1M, on a circulating supply near 174.2M AXS. That figure is the live price times circulating supply, so it captures Axie Infinity's overall size better than the per-token price does, the fairer basis for weighing it against other gaming tokens.
Axie Infinity News
-
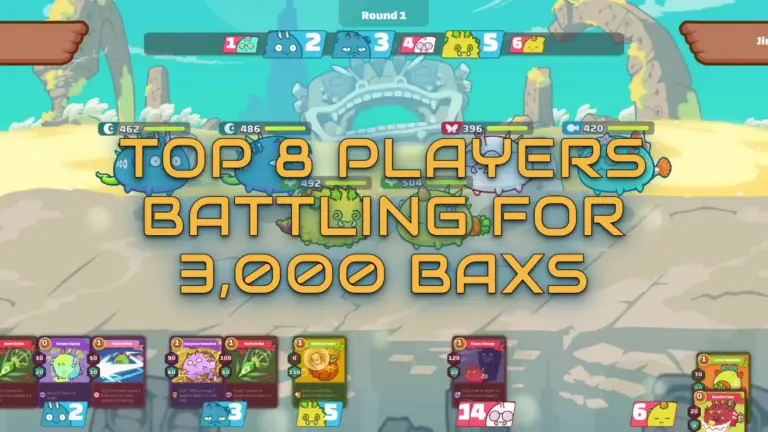 Tournament
Axie Classic Championship Live with 3,000 bAXS Prize
8 players fight for 3,000 bAXS in the Axie Classic Championship.
2 days ago
Tournament
Axie Classic Championship Live with 3,000 bAXS Prize
8 players fight for 3,000 bAXS in the Axie Classic Championship.
2 days ago
-
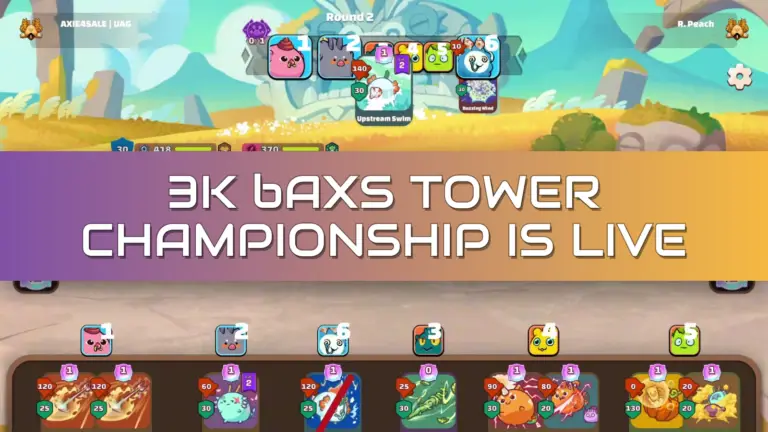 Announcement
Axie Classic S15 Offseason Blasts Off
Axie Classic’s Offseason adds Tower mode and a 3,000 bAXS championship – but token slides 12%.
6 days ago
Announcement
Axie Classic S15 Offseason Blasts Off
Axie Classic’s Offseason adds Tower mode and a 3,000 bAXS championship – but token slides 12%.
6 days ago
-
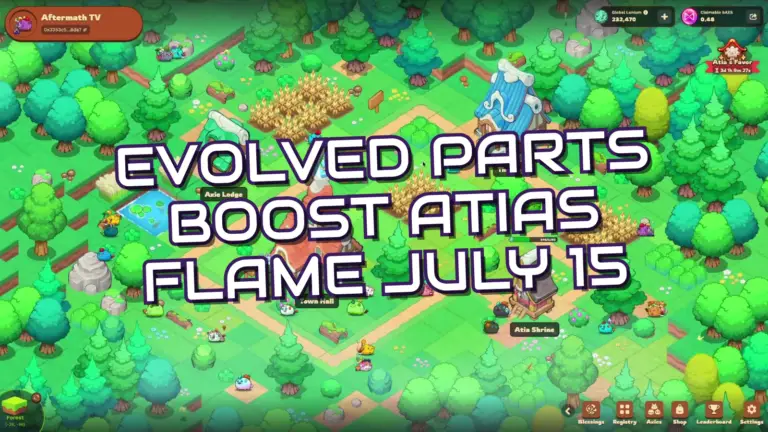 Game Update
Evolved Part Benefits Hit Terrariums July 15
Evolved parts boost Atia’s Flame and multipliers in Terrariums July 15
July 13, 2026
Game Update
Evolved Part Benefits Hit Terrariums July 15
Evolved parts boost Atia’s Flame and multipliers in Terrariums July 15
July 13, 2026
-
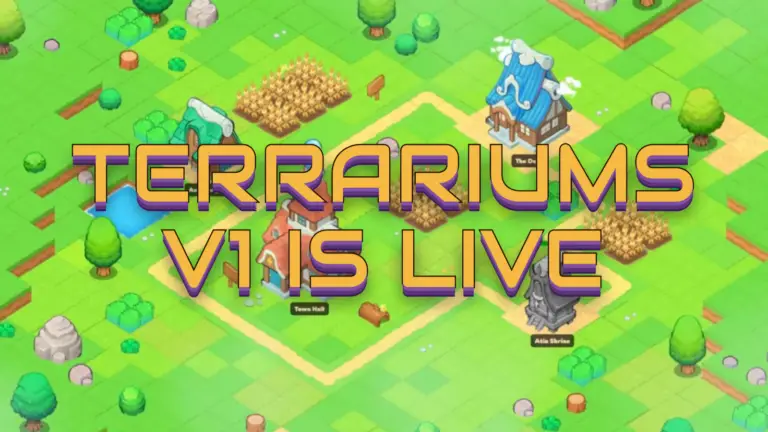 Game Release
Terrariums V1 Drops in Terrific Style
Axie Infinity launches Terrariums V1, but players divided over new land system and free perks.
June 18, 2026
Game Release
Terrariums V1 Drops in Terrific Style
Axie Infinity launches Terrariums V1, but players divided over new land system and free perks.
June 18, 2026