Ronin
RON Minimal indicatorsUSD$0.0545
-1.04%
24h
Price History
USD chart
About
Ronin
RON ranks #21 of 599 in JRPG's gaming-token index by market cap. Over the past 30 days RON has lost 11%.
JRPG's Token Health model scores it 67/100, strongest on liquidity, weakest on market interest. The Wash Trading Detector shows minimal indicators (13/100 signal score): volume outpaces comparable tokens.
Converter
Market Info
- Gaming Index Rank
- #21
- Market Cap
- $42.1M
- Fully Diluted Valuation
- $54.4M
- 24h Trading Volume
- $2.2M
- Market Cap 24h
- -0.91%
Tokenomics
Supply Breakdown
772.4M Circulating 1B Total 1B Max
Circulating 77.2%
Non-circulating 22.8%
Historical Price
- 24h Price Range
- $0.0534 – $0.0553
- 1-Year Range
- $0.0513 – $0.5983
- All-Time High
- $4.45 -98.78%Mar 26, 2024
- All-Time Low
- $0.0513 +6.34%Jul 13, 2026
Market Cap Analysis
- First Tracked
- Mar 20, 2024
- ATH Market Cap
- $1.3B
- 1Y Mcap Range
- $39.7M – $414.7M
- YTD Performance
- -58.93%
Price Performance
- 7 Days
- +0.02%
- 14 Days
- -1.16%
- 30 Days
- -11.00%
- 60 Days
- -40.17%
- 200 Days
- -60.81%
- 1 Year
- -90.82%
66.5 / 100
overall score
Weighted average: Community 30%, Liquidity 30%, Project 25%, Interest 15%
-
Liquidity Pool reserves, volume-to-liquidity ratio, and valuation 91.2
-
Project Token age, social presence, and safety signals 48.3
-
Interest Volume trends, price momentum, and market cap 47.3
13.02 / 100
risk score
· medium confidence
-
Volume / Market Cap Ratio High trading volume relative to market cap can indicate artificial volume inflation 3
-
Price-Volume Divergence High volume with minimal price movement suggests wash trading 0
-
Volume Spike Sudden volume spikes without price movement may be artificially generated 0
-
Peer Comparison Volume patterns compared against tokens in similar categories 59
30-day trend
Frequently asked about Ronin
Is Ronin in JRPG's gaming-token index?
Yes. Ronin is one of 599 constituents in JRPG's gaming-token index, ranked #21 by market cap. The index covers every eligible Web3 gaming token and reranks daily, so a token's position shifts as the market moves.
How healthy is Ronin?
JRPG's Token Health model scores Ronin 67 out of 100. Ronin scores strongest on liquidity and weakest on market interest, the high and low among the model's four on-chain signals. The rating updates daily from live on-chain data.
Does Ronin show signs of wash trading?
JRPG's Wash Trading Detector shows minimal indicators for Ronin, a 13/100 signal score. The clearest sign: volume outpaces comparable tokens. The detector reads reported trading for signs of manufactured volume, so a lower score points to organic activity and a higher one warrants caution.
How has Ronin performed recently?
Over the past 30 days Ronin has lost 11%. A 30-day window captures the token's recent trend while filtering out single-day noise.
What is Ronin's market cap?
Ronin's market cap is about $42.1M, on a circulating supply near 772.4M RON. That figure is the live price times circulating supply, so it captures Ronin's overall size better than the per-token price does, the fairer basis for weighing it against other gaming tokens.
Games on Ronin

News on Ronin
-
 Event
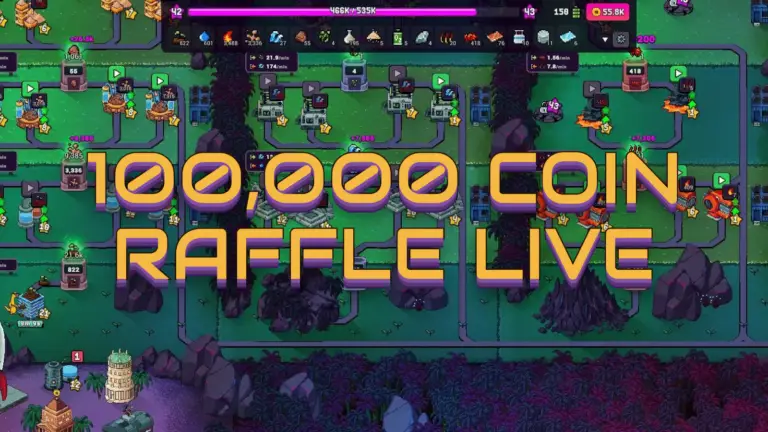
RAWRffle Brings Community Raffle to Craft World
Craft World's RAWRffle launches with 100,000 Coin in community raffle prizes.
July 7, 2026
Event
RAWRffle Brings Community Raffle to Craft World
Craft World's RAWRffle launches with 100,000 Coin in community raffle prizes.
July 7, 2026
-
 General
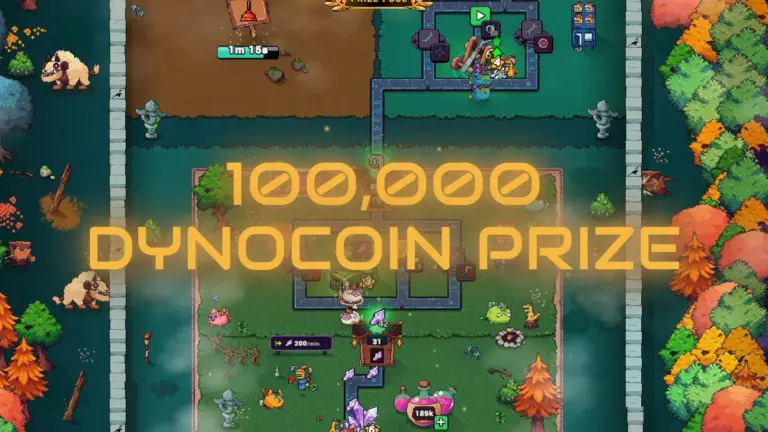
Craft World’s Factory After Dark Contest Is Live!
Craft World launches Factory After Dark contest with 100,000 Dyno Coin up for grabs.
July 1, 2026
General
Craft World’s Factory After Dark Contest Is Live!
Craft World launches Factory After Dark contest with 100,000 Dyno Coin up for grabs.
July 1, 2026
-
 Game Update
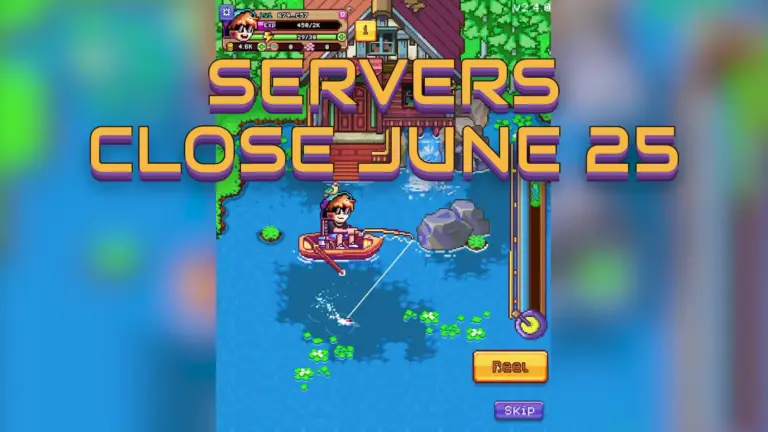
Fishing Frenzy Shuts Down: Servers Closing June 25
Fishing Frenzy closes on June 25, leaving fans with mixed feelings and USDC refunds.
June 15, 2026
Game Update
Fishing Frenzy Shuts Down: Servers Closing June 25
Fishing Frenzy closes on June 25, leaving fans with mixed feelings and USDC refunds.
June 15, 2026
-
 Event
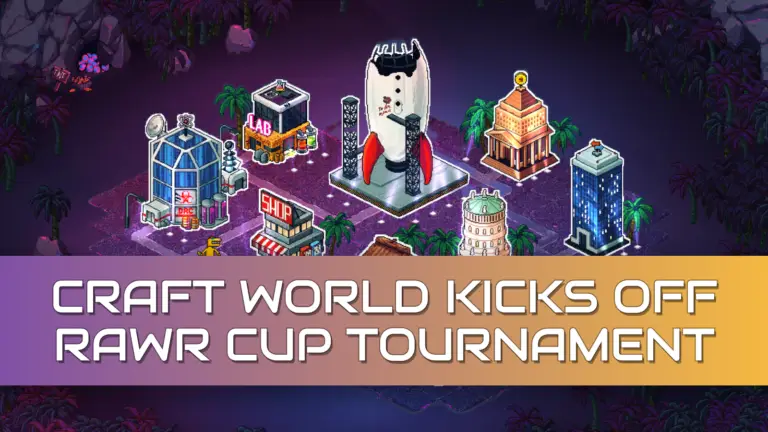
Craft World Kicks Off RAWR Cup Tournament
Craft World’s new RAWR Cup tournament has players roaring with excitement over rewards and exclusive items, even as ongoing complaints about energy systems and…
June 12, 2026
Event
Craft World Kicks Off RAWR Cup Tournament
Craft World’s new RAWR Cup tournament has players roaring with excitement over rewards and exclusive items, even as ongoing complaints about energy systems and…
June 12, 2026
-
 Event
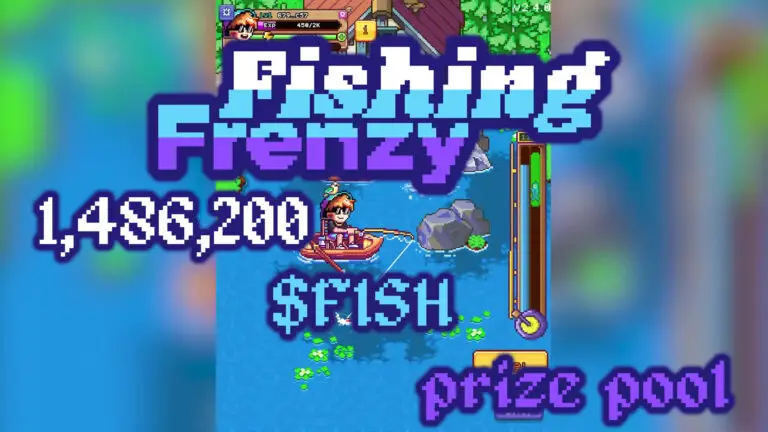
Fishing Frenzy Puts 1.4M $FISH on Ice for Its Big Catch
Win big in Fishing Frenzy's historic 1.4M $FISH token prize pool before May 7th!
April 30, 2026
Event
Fishing Frenzy Puts 1.4M $FISH on Ice for Its Big Catch
Win big in Fishing Frenzy's historic 1.4M $FISH token prize pool before May 7th!
April 30, 2026