











RaidLords
RAID Minimal indicatorsUSD$0.000014
-0.88%
24h
Price History
USD chart
About
RaidLords
RAID is a token tracked on JRPG. JRPG's Token Health model scores it 17/100, strongest on project fundamentals, weakest on liquidity.
The Wash Trading Detector shows minimal indicators, a 1.6/100 trailing average over the 20 days scored. Four of its checks read reported market data. The fifth reads on-chain trades and had no reading for RAID.
Converter
RAID
1 RAID = $0.000014
Market Info
- Market Cap
- $10k
- Fully Diluted Valuation
- $10k
- 24h Trading Volume
- $69
- Market Cap 24h
- -1.08%
Tokenomics
Supply Breakdown
676.7M Circulating 990.6M Total 1B Max
Circulating 68.3%
Non-circulating 31.7%
Historical Price
- 24h Price Range
- $0.000014 – $0.000015
- 1-Year Range
- $0.000013 – $0.000568
- All-Time High
- $0.00066 -97.81%Oct 27, 2026
- All-Time Low
- $0.000013 +7.77%Nov 15, 2026
Market Cap Analysis
- First Tracked
- Oct 27, 2026
- ATH Market Cap
- $90k
- 1Y Mcap Range
- $9k – $90k
- YTD Performance
- -96.30%
Price Performance
- 7 Days
- -23.77%
- 14 Days
- -60.93%
17.1 / 100
overall score
Weighted average: Community 30%, Liquidity 30%, Project 25%, Interest 15%
-
Liquidity Pool reserves, volume-to-liquidity ratio, and valuation 0.4
-
Project Token age, social presence, and safety signals 30.3
-
Interest Volume trends, price momentum, and market cap 28.8
1.6 / 100
trailing average · 20 days scored
2.3
today's reading
0 of 20 days scored had the trailing average above 45 with two or more sub-scores accusing.
-
Volume / Market Cap Ratio High reported volume relative to market cap can indicate artificial volume inflation not measured
-
Price-Volume Divergence High volume with minimal price movement suggests the same entity is trading with itself 6
-
Volume Spike A sudden jump against the token's 30-day average volume, without a matching price move 0
-
Peer Comparison The token's volume-to-market-cap ratio against the median of tokens in the same categories not measured
-
Round Trips Share of captured on-chain trades whose buy the same wallet reversed within 30 minutes at a matching size. One-sided: it can raise the score and never lower it, because the trade capture is a daily sample rather than a complete record not measured
Trailing average, last 20 days scored
Frequently asked about RaidLords
How healthy is RaidLords?
JRPG's Token Health model scores RaidLords 17 out of 100. RaidLords scores strongest on project fundamentals and weakest on liquidity, the high and low among the model's four on-chain signals. The rating updates daily from live on-chain data.
Does RaidLords show signs of wash trading?
JRPG's Wash Trading Detector shows minimal indicators for RaidLords, a 1.6/100 trailing average over the 20 days scored. Four of its checks read reported market data. The fifth reads on-chain trades and had no reading for RaidLords. A high score marks reported volume worth treating with caution, and a low one means only that these checks found nothing to flag. These are our model's readings, not a finding that anyone has done anything.
What is RaidLords's market cap?
RaidLords's market cap is about $10k, on a circulating supply near 676.7M RAID. That figure is the live price times circulating supply, so it captures RaidLords's overall size better than the per-token price does, the fairer basis for weighing it against other gaming tokens.
Games Using RAIDLORDS

RaidLords News
-
 Economy
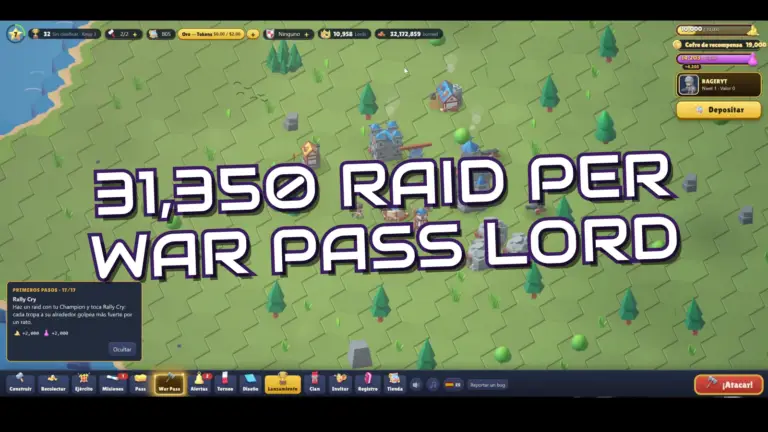
RAID Token Share Drop Sparks RaidLords Withdrawal Complaints
RaidLords now splits unused RAID token withdrawal allowances among its 314 War Pass lords every 12 hours, but some players say they still can't…
November 5, 2026
-
 Game Release
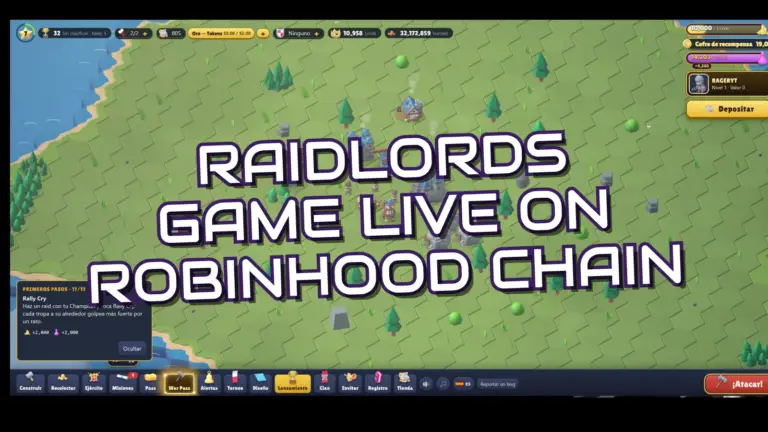
RaidLords Is Live on Robinhood Chain and Open to Everyone
RaidLords is live in the browser on Robinhood Chain, and more than 15,000 players joined in its first 24 hours.
October 28, 2026